Measure the ratio of new versus returning visitors to your store/location.
Learn about your visitor trends to enhance store layouts, find deeper insights into your customer base, and tailor messaging.
Understand Visit Duration
Determine how long your visitors are in-store to better support staffing, and scheduling
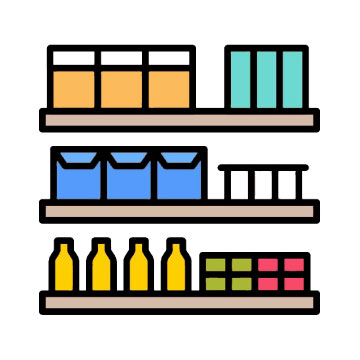
Track Walk Bys
Analyze the potential foot traffic at your stores location to leverage marketing messaging.
Offer Free Wi-Fi with custom log in splash page
Offer guest Wi-Fi to your visitors with custom login splash page experiences unique to your store.
Connect to Your BI Tools
Pipe your stores visitation data into your own business (BI) intelligence tools in real-time.
Compare store traffic to other internal data assets, like POS, sales, volume, staffing, active, marketing, campaigns, and more.
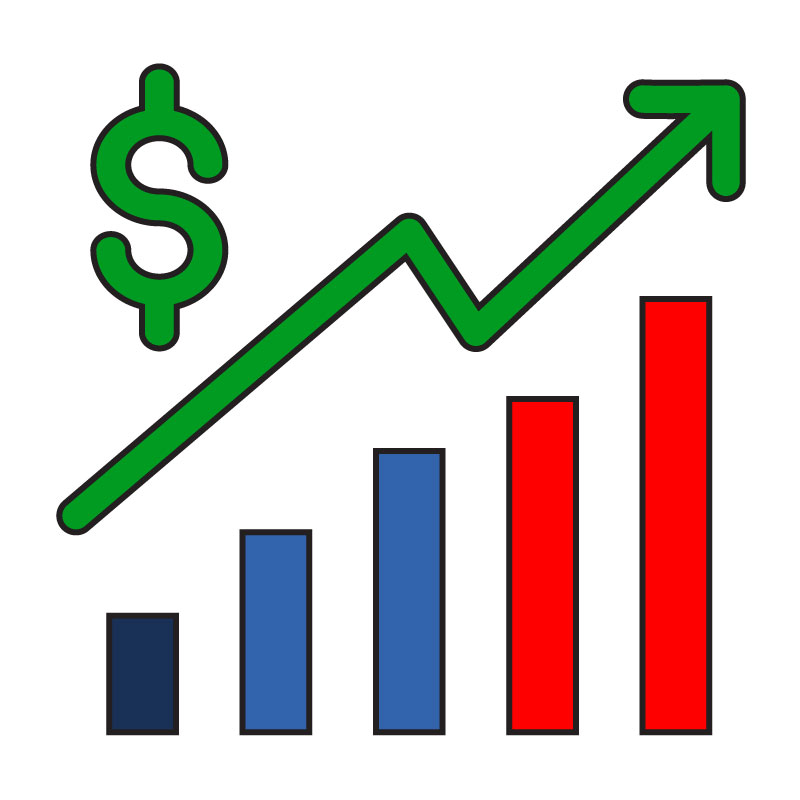
Revenue Generation associated with ”The Connected Customer Experience” is represented by the Eight (8) key phases labeled below. This comprehensive approach allowed us to identify specific opportunities for technology integration and the ability to measure value creation that align with Floor & Decor’s strategic vision. See the next page to view the Use Cases associated with this Value Driver.
Floor & Decor Connected Customer Experience
Understand the Behavior of Your Customers with in-store analytics